AI Chatbot Deflection Rate Benchmark: Why Numbers Differ
Containment and deflection have different denominators and the same name, which is why published ranges disagree more inside a sector than between sectors.
AI-drafted, reviewed by Muhammad Qasim Hammad on October 2, 2026. See our AI disclosure.
Table of contents
Somebody will ask what good looks like, and there is a number ready for them. Any AI chatbot deflection rate benchmark you find is measuring a different thing from the one next to it, and most are published by companies selling the software. The ranges disagree because the denominators disagree, not because the industries do.
What are these numbers actually measuring?#
Two different fractions wearing the same name. Containment is the share of conversations that entered the automated channel and finished there without escalating. Deflection is the share of contacts that never reached the support queue at all. The first has a denominator of bot conversations; the second has a denominator of everyone who wanted help.
That difference is large enough to reverse a comparison. A product where only motivated users ever find the chat widget can report excellent containment while deflecting very little, because the denominator was already filtered down to easy cases. A prominent widget catching everyone reports worse containment and might deflect far more real volume.
Neither number says the customer was satisfied, and neither says the problem was solved. A conversation that ended because the person gave up is contained, deflected, and a failure, and no standard definition excludes it. That is not a subtle measurement gap, it is most of the reason these figures are optimistic.
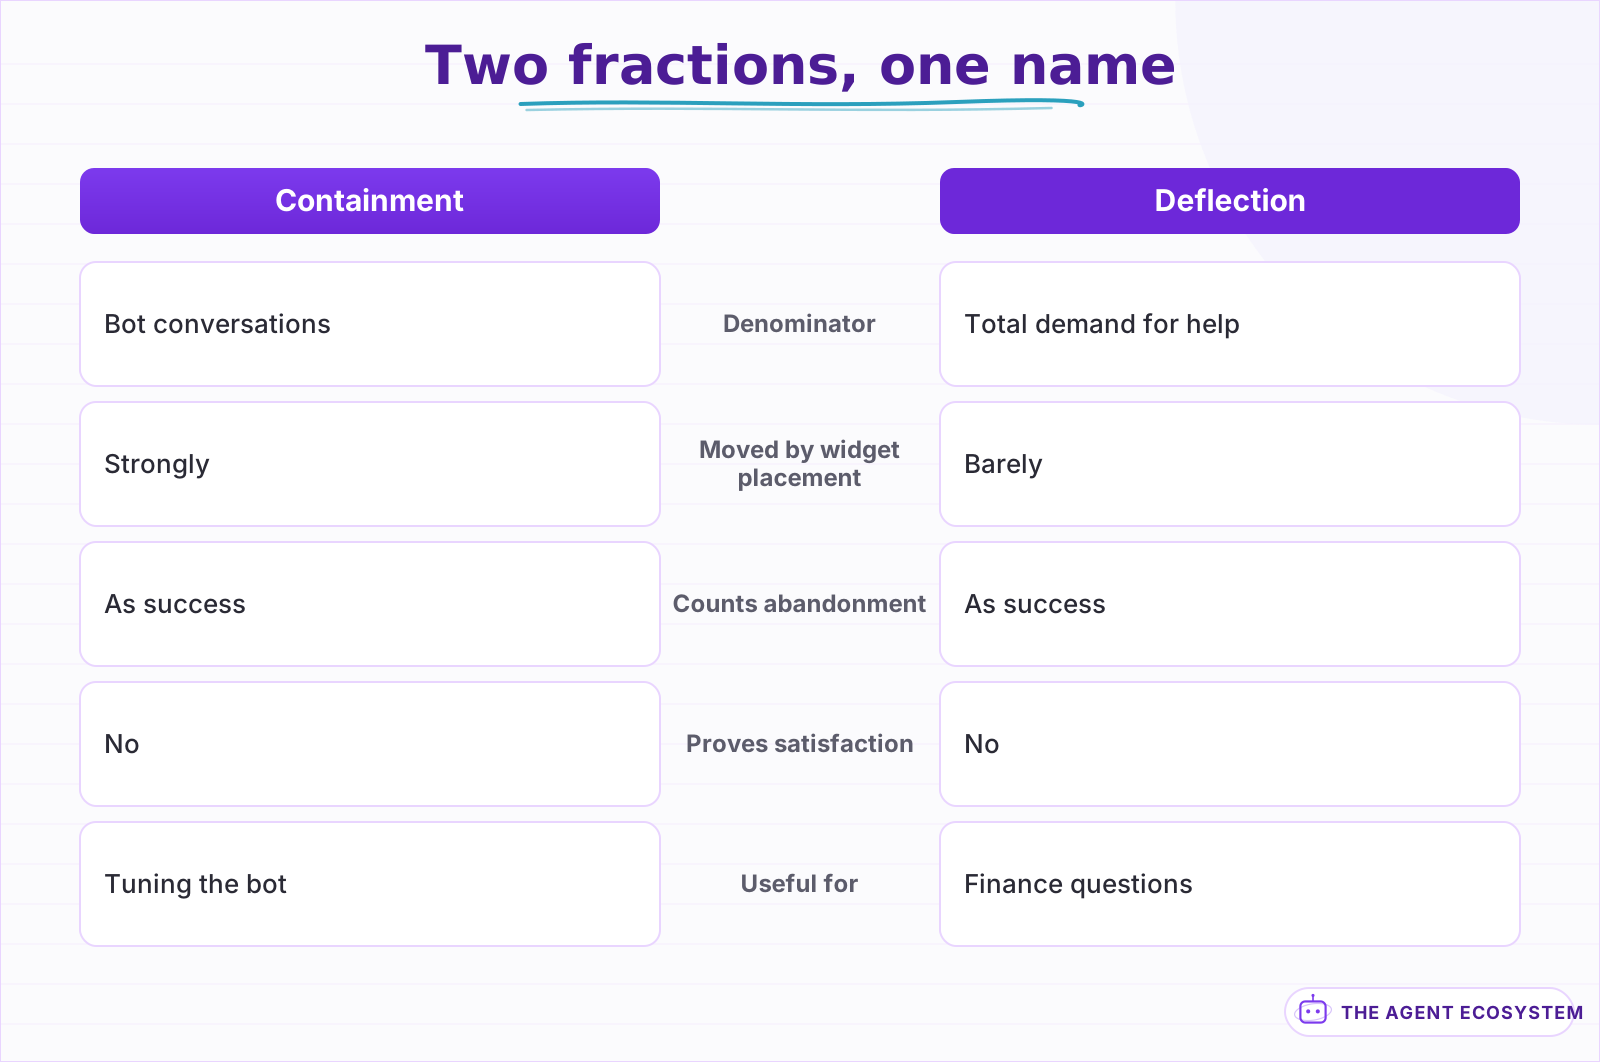 The denominator row is the whole disagreement. Everything below it follows from that one difference.
The third term nobody separates out is the baseline. Some share of those people would have solved it from a help page or given up before ever opening a ticket, so a bot placed in front of that traffic inherits credit for deflection that was already happening.
Why do published benchmarks disagree so much?#
Because they are marketing artefacts with incompatible definitions. Search for a benchmark and the sources returned are overwhelmingly vendor blogs, and the figures they carry range from most chatbots containing 20 to 40 percent, to most teams deflecting 20 to 30 percent, to sector ranges running from around 35 percent up past 80.
| Reported figure | What it is probably measuring | Why it will not transfer |
|---|---|---|
| Most chatbots contain 20 to 40 percent | Bot conversations ending without escalation | Denominator depends on widget placement |
| Leaders reach 70 to 90 percent | Mature deployments, narrow scope | Selection effect, self-reported |
| Most teams deflect 20 to 30 percent | Contacts never reaching the queue | Depends on prior self-service quality |
| Sector ranges of 35 to 80 percent | Mixed containment and deflection | Definitions differ within one table |
The spread inside a single sector is usually wider than the gap between sectors, which is the tell. If healthcare ranges from 35 to 55 percent and the difference between two healthcare companies is mostly definitional, the sector average is describing measurement practice rather than performance.
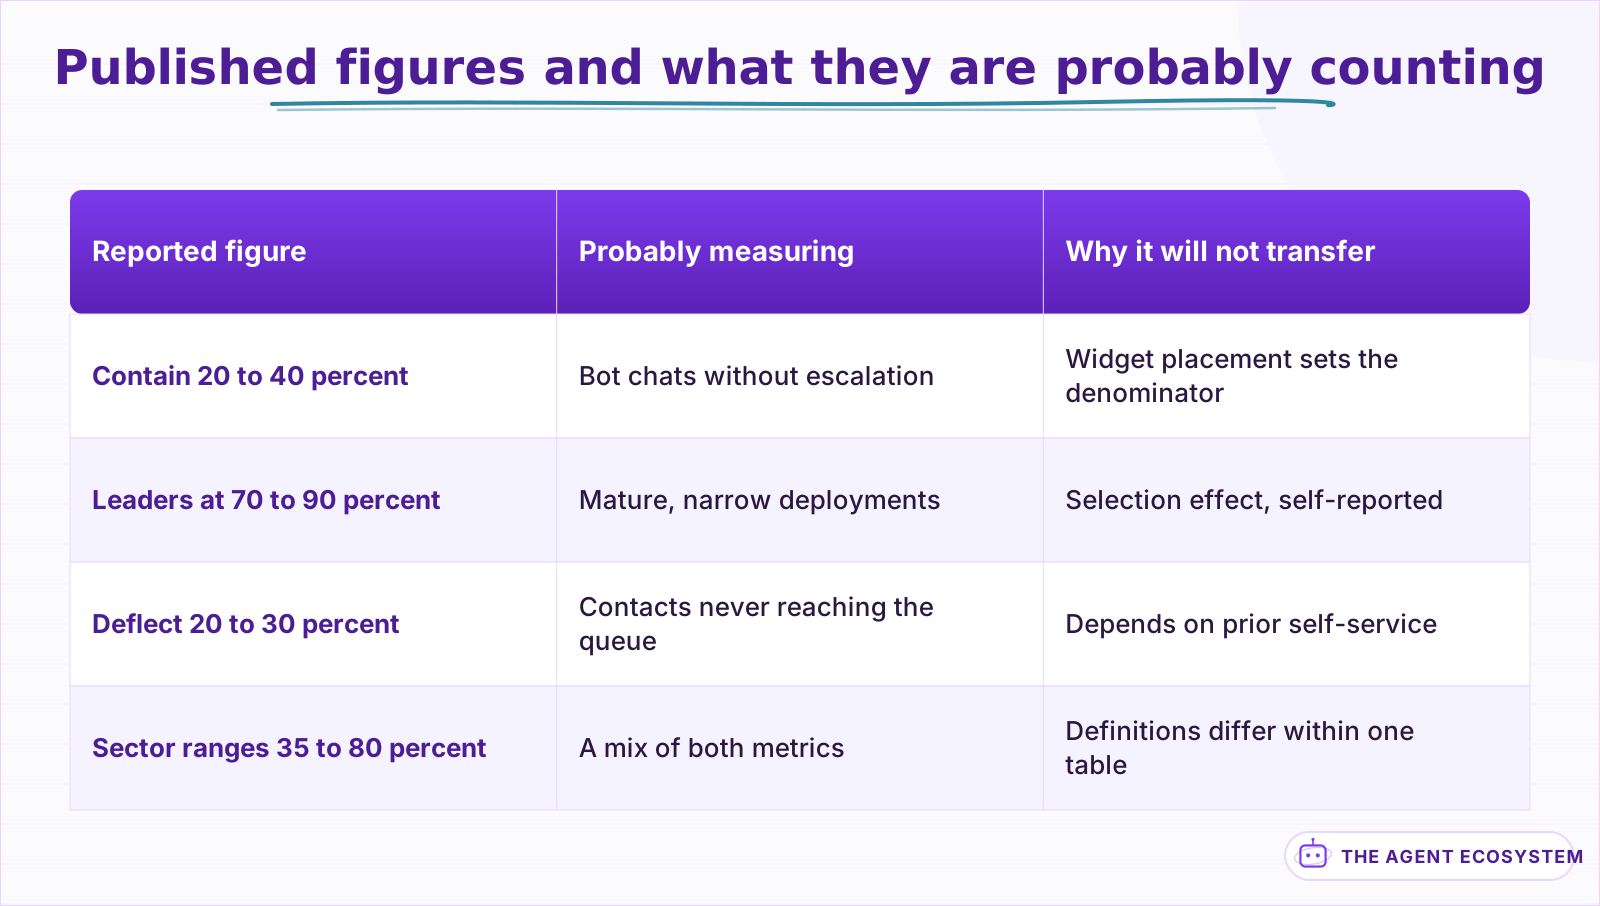 Four figures, four denominators. A gap against any of them is more likely definitional than real.
There is a second tell worth knowing. Figures in these posts are frequently attributed to a named analyst firm without a link to anything you can open, and the same attribution appears with different numbers across different vendors' blogs. Treat an uncited analyst attribution as the vendor's own estimate, because that is functionally what it is.
None of this makes the vendors dishonest. It makes the figures unusable as targets, because you cannot tell whether a gap between your 32 percent and a published 65 percent is a performance gap or a denominator gap, and the answer is usually the second one.
What would an honest internal number look like?#
Contacts that reached a human, divided by total demand for help, measured the same way before and after. That is the number your finance team is actually asking about, it is unaffected by how the widget is positioned, and it is the one that moves when the automation genuinely works.
Define demand carefully, because it is the term that shifts. Total demand includes tickets, chats, calls and anything else that lands in the support queue, plus the bot conversations, and it should not include people browsing the help centre unless it did before too. Consistency matters more than getting the boundary philosophically right.
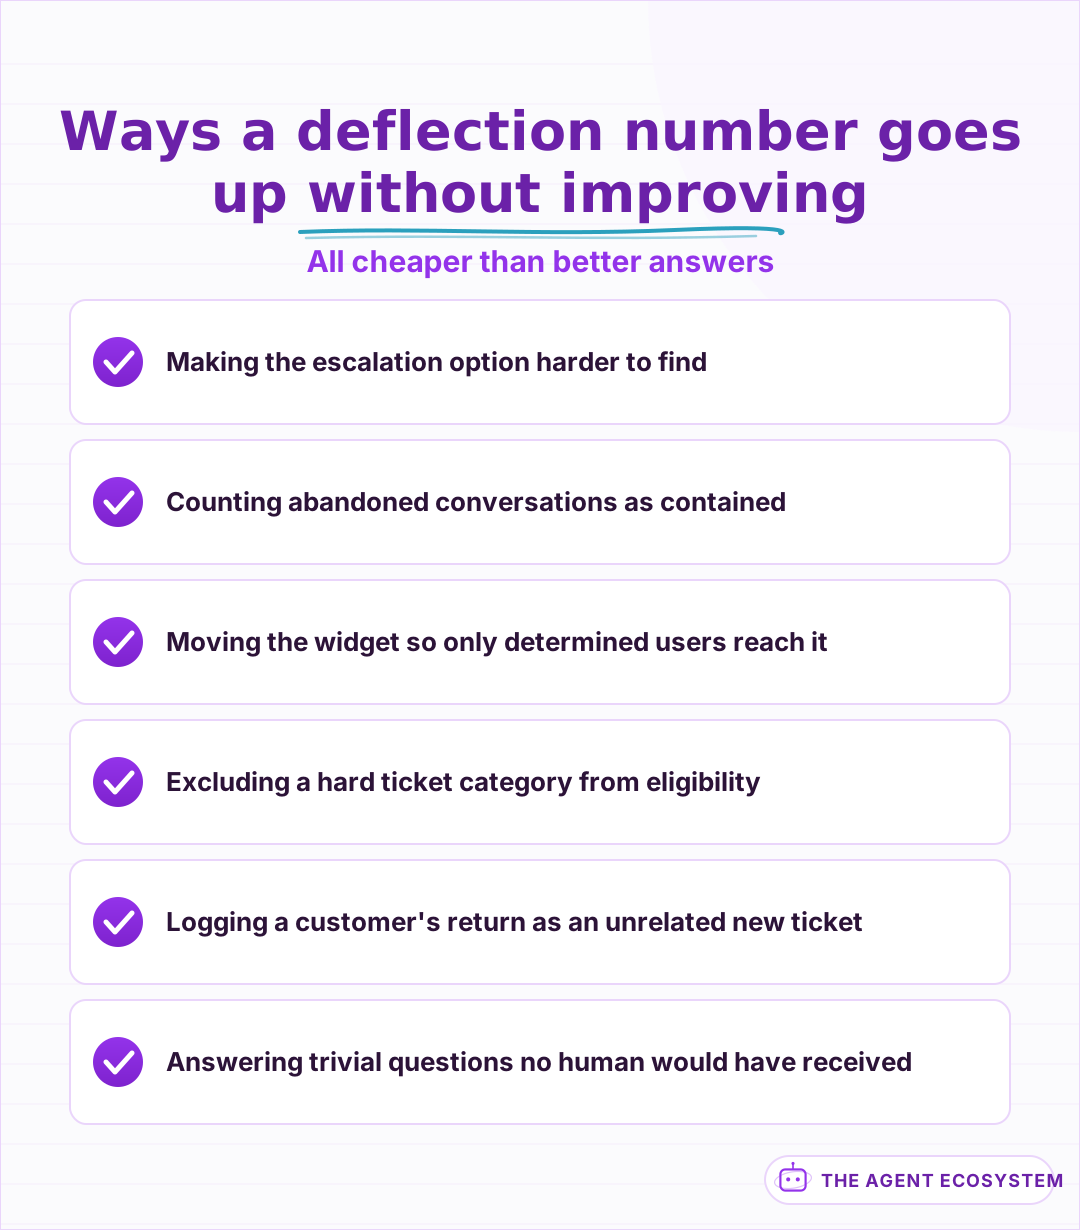 Every one of these is cheaper than writing better answers, which is why targets get hit this way.
Why is before and after the wrong experiment?#
Because too much moves at once. Ticket volume is seasonal, your product changed, a pricing page was rewritten, and the bot launched alongside a help centre refresh that nobody counted. A before and after comparison attributes every one of those to the automation, and it does so in whichever direction the numbers happen to fall.
The clean version is a holdout. Route a fraction of eligible traffic straight to the existing path, keep the rest going through the bot, and compare human contact rates between the two groups over the same weeks. The seasonality, the product changes and the help centre refresh apply equally to both arms, so what remains is the effect you actually wanted to measure.
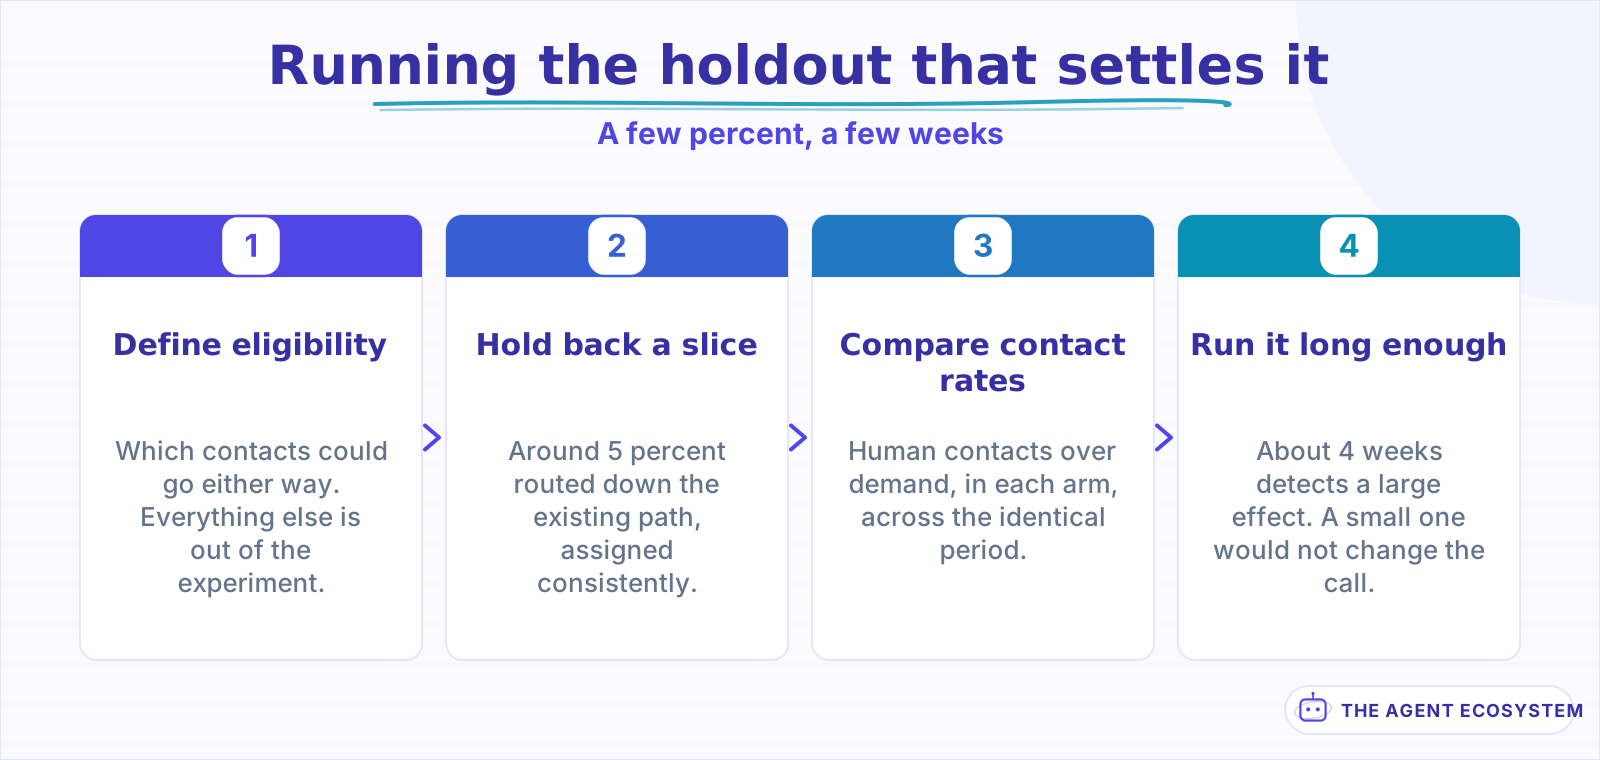 Both arms live through the same weeks, so seasonality and releases cancel instead of being attributed.
Size it by how big an effect you would act on rather than by what feels safe. A holdout of 5 percent of traffic over 4 weeks is enough to detect a large effect and will not settle a small one, which is usually fine, because a small effect would not change the decision anyway. Decide which of those you are looking for before you start.
A holdout is unpopular because it means deliberately not serving some customers with the new thing, which sounds wasteful when everyone already believes it works. It costs a few percent of traffic for a few weeks and it is the difference between knowing the effect and asserting it. Run it once at launch and you will not need to argue about attribution afterwards.
What is worth watching instead of the rate?#
Re-contact within a week, escalation quality, and the share of the queue that is genuinely hard. Re-contact tells you whether deflection was real. Escalation quality tells you whether a person receiving a handover has the context or is starting over. The queue mix tells you whether the agent is absorbing work or just the easy part of it.
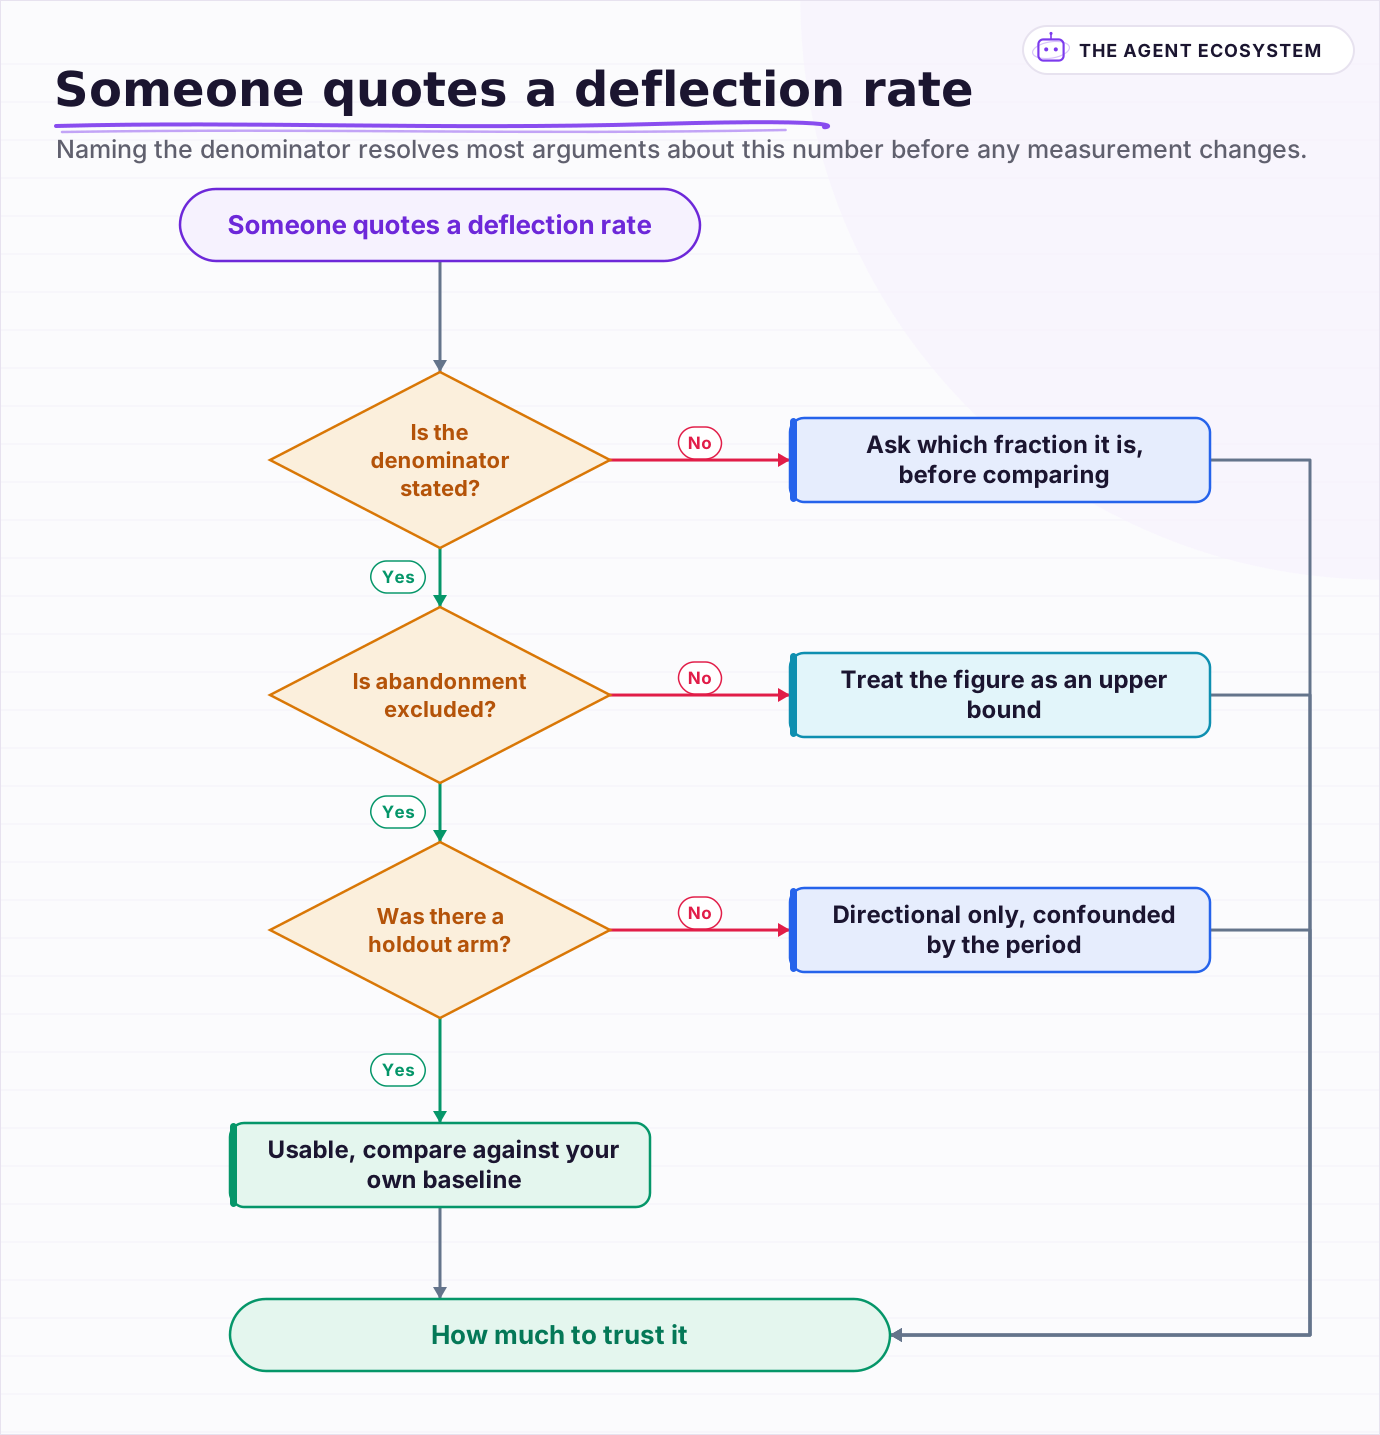 Naming the denominator resolves most arguments about this number before any measurement changes.
Each of those three has a cheap version and an honest version. Re-contact is cheap to compute from existing ticket data and needs no new instrumentation. Escalation quality needs somebody to read 20 handovers a month and say whether they were usable. Queue mix needs categories that were defined before the agent existed, or you will be comparing labels that changed underneath you.
Track the rate too, but as a diagnostic rather than a target. The moment deflection becomes a number somebody is accountable for hitting, it gets hit, and the ways to hit it are all cheaper than improving the answers. Cost per resolved ticket is the harder metric to game, because it puts escalation labour and rework back into the same fraction.
Frequently asked questions
What is the difference between containment rate and deflection rate?
What is a good chatbot deflection rate?
Why can't I compare my rate to an industry benchmark?
How should we measure deflection honestly?
Is a before and after comparison good enough?
Written by

Muhammad Qasim Hammad is an AI agent and automation expert and the founder of Cart Gaze LLC (cartgaze.com). He builds product for the love of it: when an idea lands, a working prototype is usually running within hours, built with the same AI agents and automations he sells. He puts his own output at roughly 20× what it was before agents, and the Agentic OS behind this site is the working proof, documented in public with the tools he actually ran and what they really cost.
AI & Automation Services
Want a pipeline like this running in your business?
I'm Qasim — I design and ship AI agents and n8n automations for solo operators and small teams. Tell me what's eating your team's week, and I'll scope a fix.
Related reading
AI Agent Cost Per Resolved Ticket: The Honest Version
The dashboard says the bot handled 4,000 conversations last month and cost very little. Cost per resolved ticket is a different number, usually several times larger.

How to Automate Customer Support with AI Without Losing People
The fastest way to damage a small business with AI is to put a bot in front of customers before it knows when to stop. Twelve lessons on triage before answers, grounding in your own documentation, escalation that carries context, and why deflection rate flatters you.
Why AI Pilots Fail to Reach Production, and What Works
A pilot that answered 40 questions correctly in a demo is not evidence of anything yet. It is a controlled test on data somebody picked, and production asks a different question entirely.
AI Agent Error Budget: Pick a Failure Rate You Can Ship
Nobody ships an agent that is right every time, so the only honest question is how often it may be wrong. The version borrowed straight from web reliability breaks on the first day.
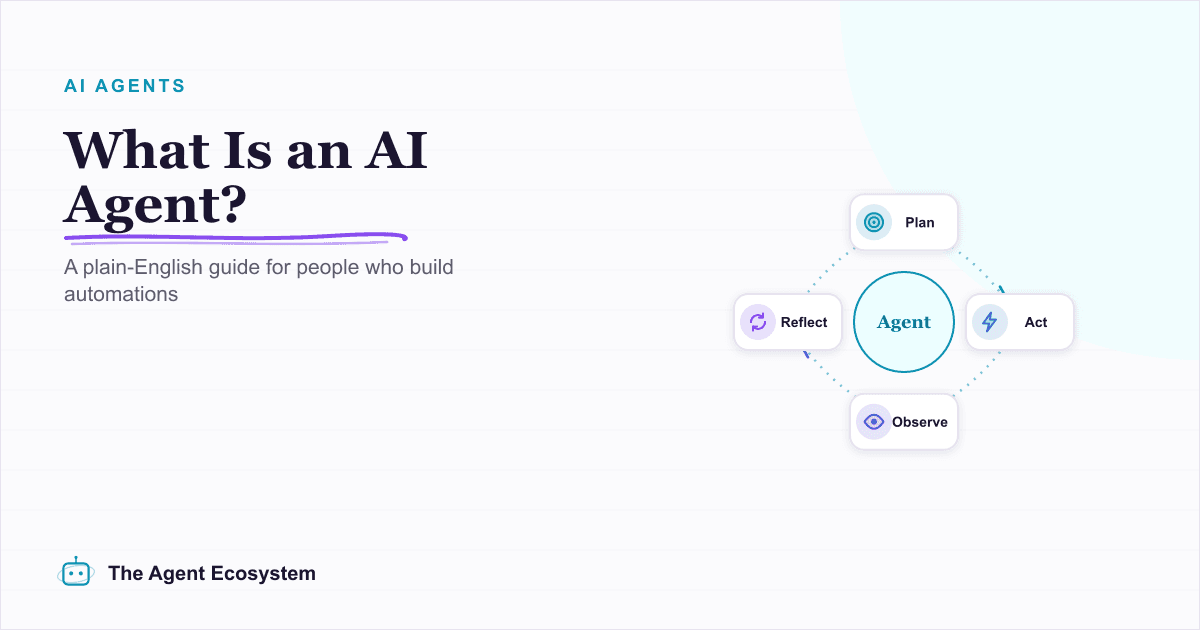
What Is an AI Agent? A Plain-English Guide for Builders
An AI agent is a language model running in a loop that decides its own next action, not a chatbot and not a chain. Here is how the perceive-decide-act-observe loop works, how an agent differs from a chatbot, chain, and workflow, and a checklist for when you actually need one.
AI Automation ROI: How to Tell If It Actually Paid Off
Almost every AI automation ROI claim is unfalsifiable. Twelve lessons on the four cost meters people miss, why time saved is the weakest number you have, computing payback instead of a percentage, and deciding the kill threshold before you need it.