AI Agent Observability: Tracing, Metrics, and Cost in Production
Capture every step of a live agent run so a wrong answer becomes a span you can point at.
AI-drafted, reviewed by Muhammad Qasim Hammad on July 18, 2026. See our AI disclosure.
Table of contents
Your agent gave a wrong answer, and you have no idea where it went off the rails. Was it the retrieved context, a bad tool call, a truncated prompt, or the model itself? You cannot answer that by re-reading the final output. You need to see the run.
What is AI agent observability?#
AI agent observability captures each step of a production agent run as connected data so you can replay a failure and find the exact point it broke. It records the LLM calls, the tool calls, and the prompts and outputs of a single request, correlated by one id. It answers "what happened", not "is the agent good".
This is a different job from testing. Evaluation runs before you ship and scores the agent against a fixed set of cases. Observability runs after you ship and watches real traffic you never anticipated. If you want the pre-release side, our guide to testing and evaluating AI agents in n8n covers that half. This post is about the 3am incident, when a real user got a wrong answer and you have to explain why.
The three pillars: traces, metrics, and logs#
Classic observability rests on 3 signals, and each maps cleanly onto an agent. Traces show the run as a tree of steps. Metrics count and time those steps in aggregate. Logs hold the raw prompt and output text. Together these 3 pillars move you from "something is wrong" down to the one span that caused it.
Here is how each pillar maps to a question you will actually ask during an incident.
| Pillar | What it captures for an agent | Question it answers |
|---|---|---|
| Traces | The run tree of LLM calls and tool calls as parent and child spans, correlated by one trace id | Where in this specific run did it break? |
| Metrics | Tokens in and out, cost, latency, error rate, tool-call counts, loop iterations | Is this slow, expensive, or failing across many runs? |
| Logs | The actual prompts sent and the raw outputs returned at each step | What exactly did the model see and say? |
A trace is the backbone. One user request becomes one trace, and every model call or tool call inside it becomes a span nested under that trace. Because all 3 signals share the trace id, you can jump from a spiking latency metric to the exact trace, then read the logged prompt on the slow span without guessing.
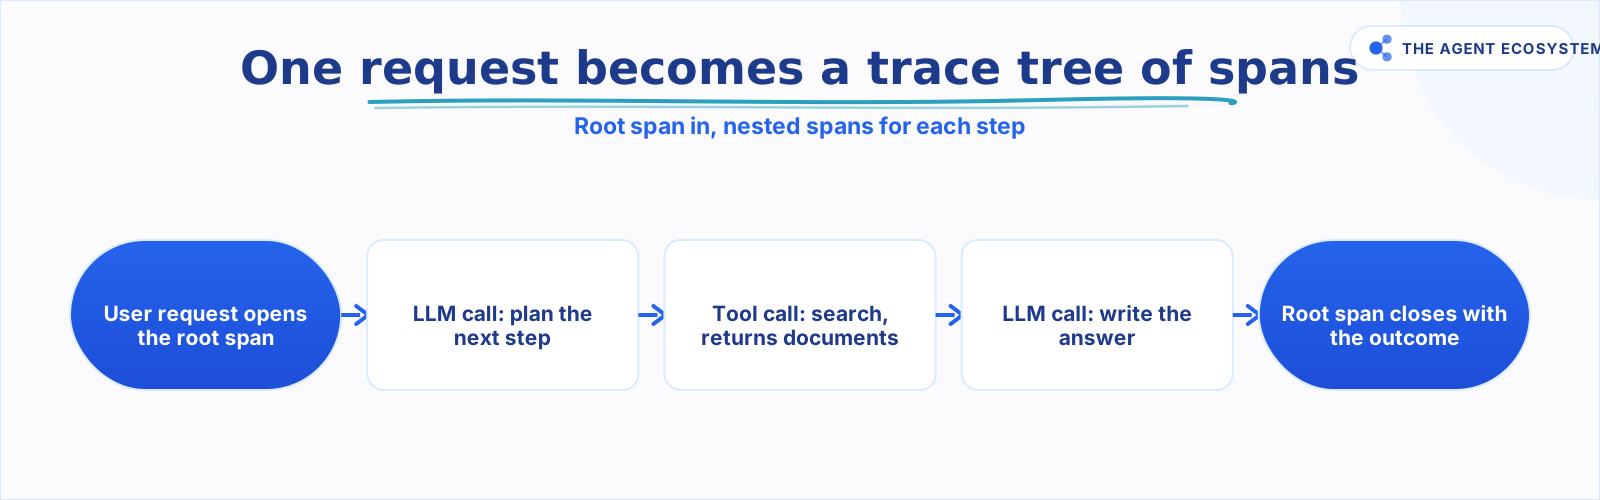 One request equals one trace. Each LLM call and tool call is a child span under it, correlated by one trace id.
How does a trace tree work for an agent?#
A trace is one request rendered as a tree of spans. The root span is the whole run. Under it sit child spans for each LLM call and each tool call, in order, each stamped with a start time and duration. Parent and child spans share one trace id, so the tree reconstructs the agent's real path step by step.
Say a user asks your support agent a question. The root span opens. The agent makes a first LLM call to plan, which becomes a child span. That plan decides to call a search tool, so a tool span opens, runs for 0.8 seconds, and returns 5 documents. A second LLM call reads those documents and writes the answer. If the answer is wrong, you open the trace and see immediately whether the search span returned junk or the final model call ignored good context. The OpenTelemetry project publishes GenAI semantic conventions that define standard names for these LLM spans, so a trace from one library reads the same in any compatible tool.
What should you capture per step?#
Capture enough per step to reproduce and price the run without re-running it. For every LLM call and tool call, record the input, the model or tool name, tokens in and out, cost, latency, and the result. Skip any one of these and you will hit a failure you cannot explain.
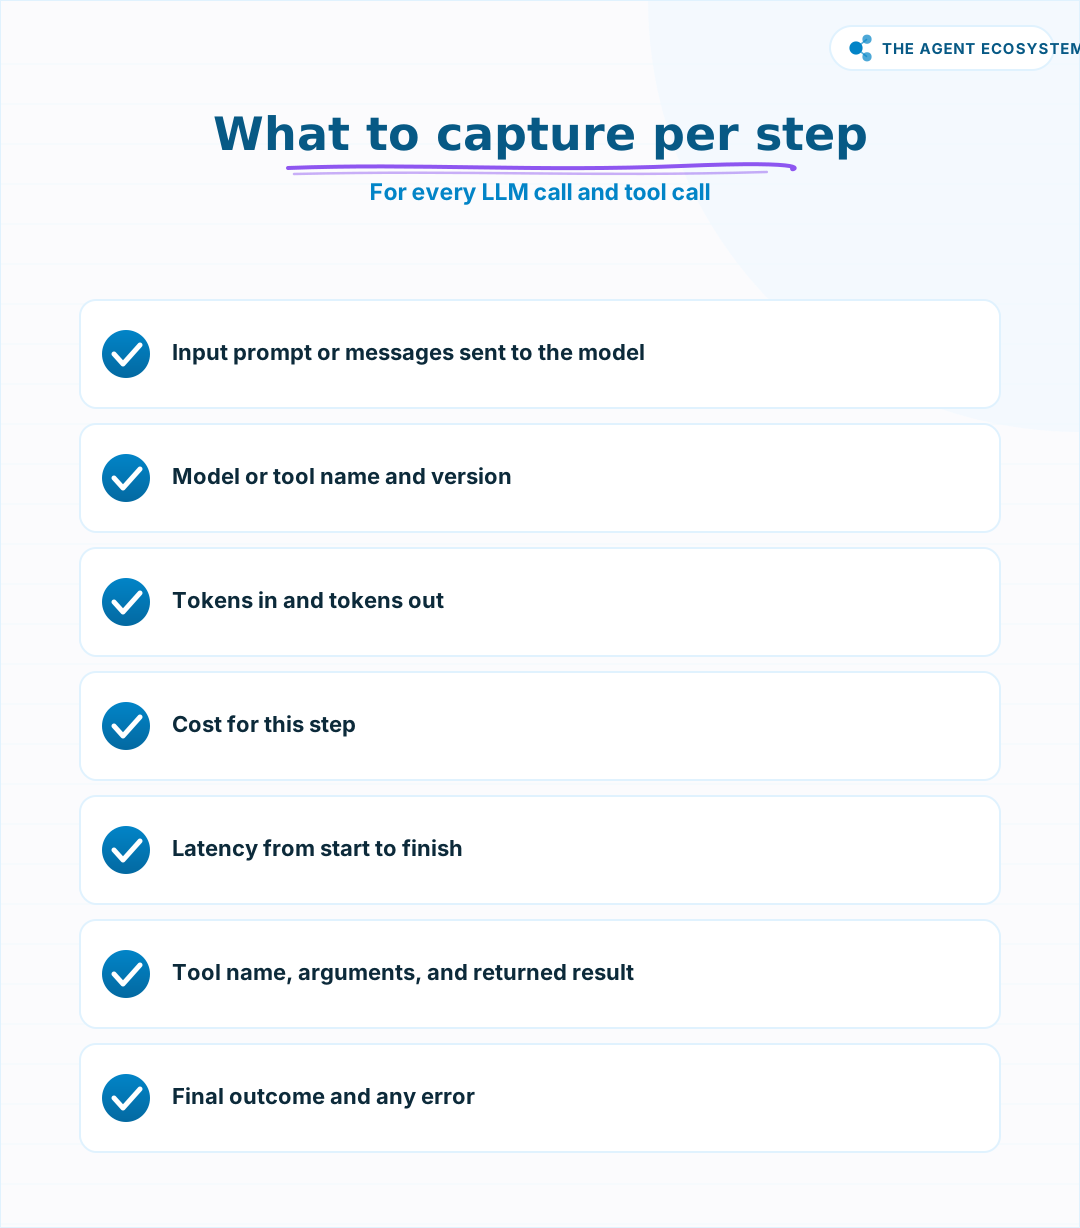 Log all of these per step. The field you skip is usually the one you need during an incident.
Two fields do the heavy lifting and get skipped most. Cost per step turns a vague "our bill went up" into "this one tool loops 7 times and burns tokens each pass". Tool arguments and results turn "the agent hallucinated" into "the API returned an error string and the model treated it as data". Capture the arguments a tool was called with, not just that it was called, or you lose the ability to tell a bad call from a bad response.
n8n execution log versus a dedicated tool#
If you build agents in n8n, you already have a basic trace. The execution log shows every node's input and output for a run, which is enough to see that data entered a node wrong or a branch went the wrong way. For LLM-level detail like per-call tokens and cost, push spans to a dedicated tool.
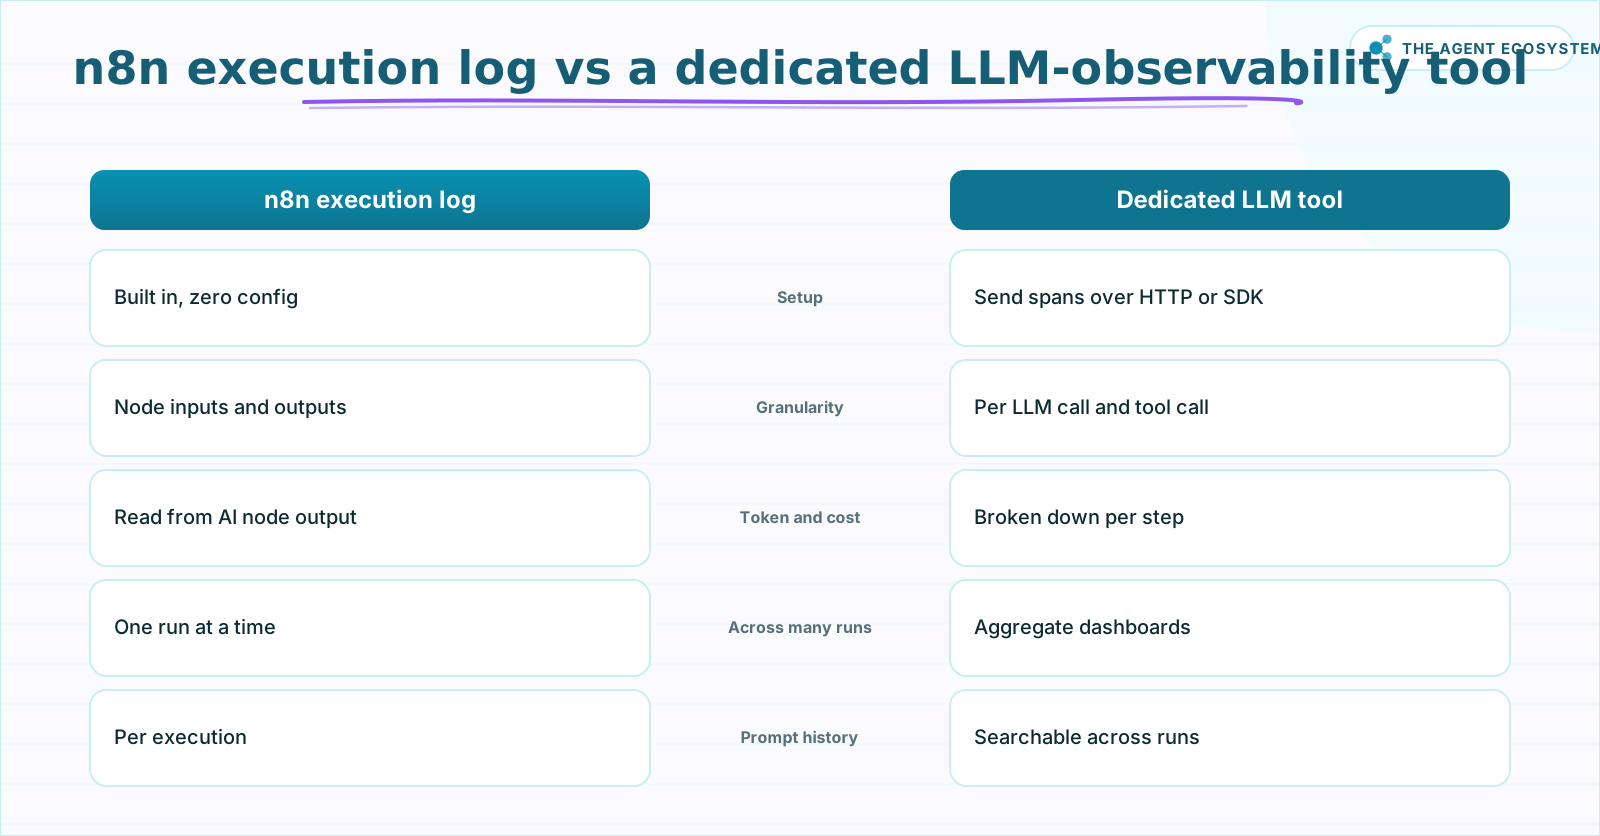 The n8n log is a free node-level trace; a dedicated tool adds per-call token, cost, and latency detail plus dashboards.
The split is about depth. The n8n log answers node-level questions and needs zero setup, and for many workflows that is genuinely enough. A dedicated LLM-observability tool adds the per-call token, cost, and latency breakdown, plus aggregate dashboards across thousands of runs and a searchable prompt history. You can bridge the two: send spans from n8n to a tool like Langfuse over HTTP, or start by reading the usage object the AI node returns and logging it. If you are wiring tools into an n8n agent in the first place, our guide to giving an n8n AI agent tools covers that side.
Which observability tool should you use?#
Pick by whether you need self-hosting and how much you want built for you. Langfuse is open-source and self-hostable, so it fits teams that must keep prompt data in-house. LangSmith, Helicone, and Arize Phoenix are the other common names. OpenTelemetry GenAI conventions are the emerging open standard, so favor tools that speak it.
The honest advice is to not adopt any of them on day one. A single agent with light traffic is served fine by structured logs and your framework's own run view. Reach for a dedicated tool when volume, cost, or a multi-agent setup makes raw logs impossible to search. The Langfuse documentation is a reasonable place to see what a full tracing layer offers before you commit. When you graduate to several agents handing work to each other, tracing stops being optional, which is why our multi-agent orchestration guide treats it as a core concern.
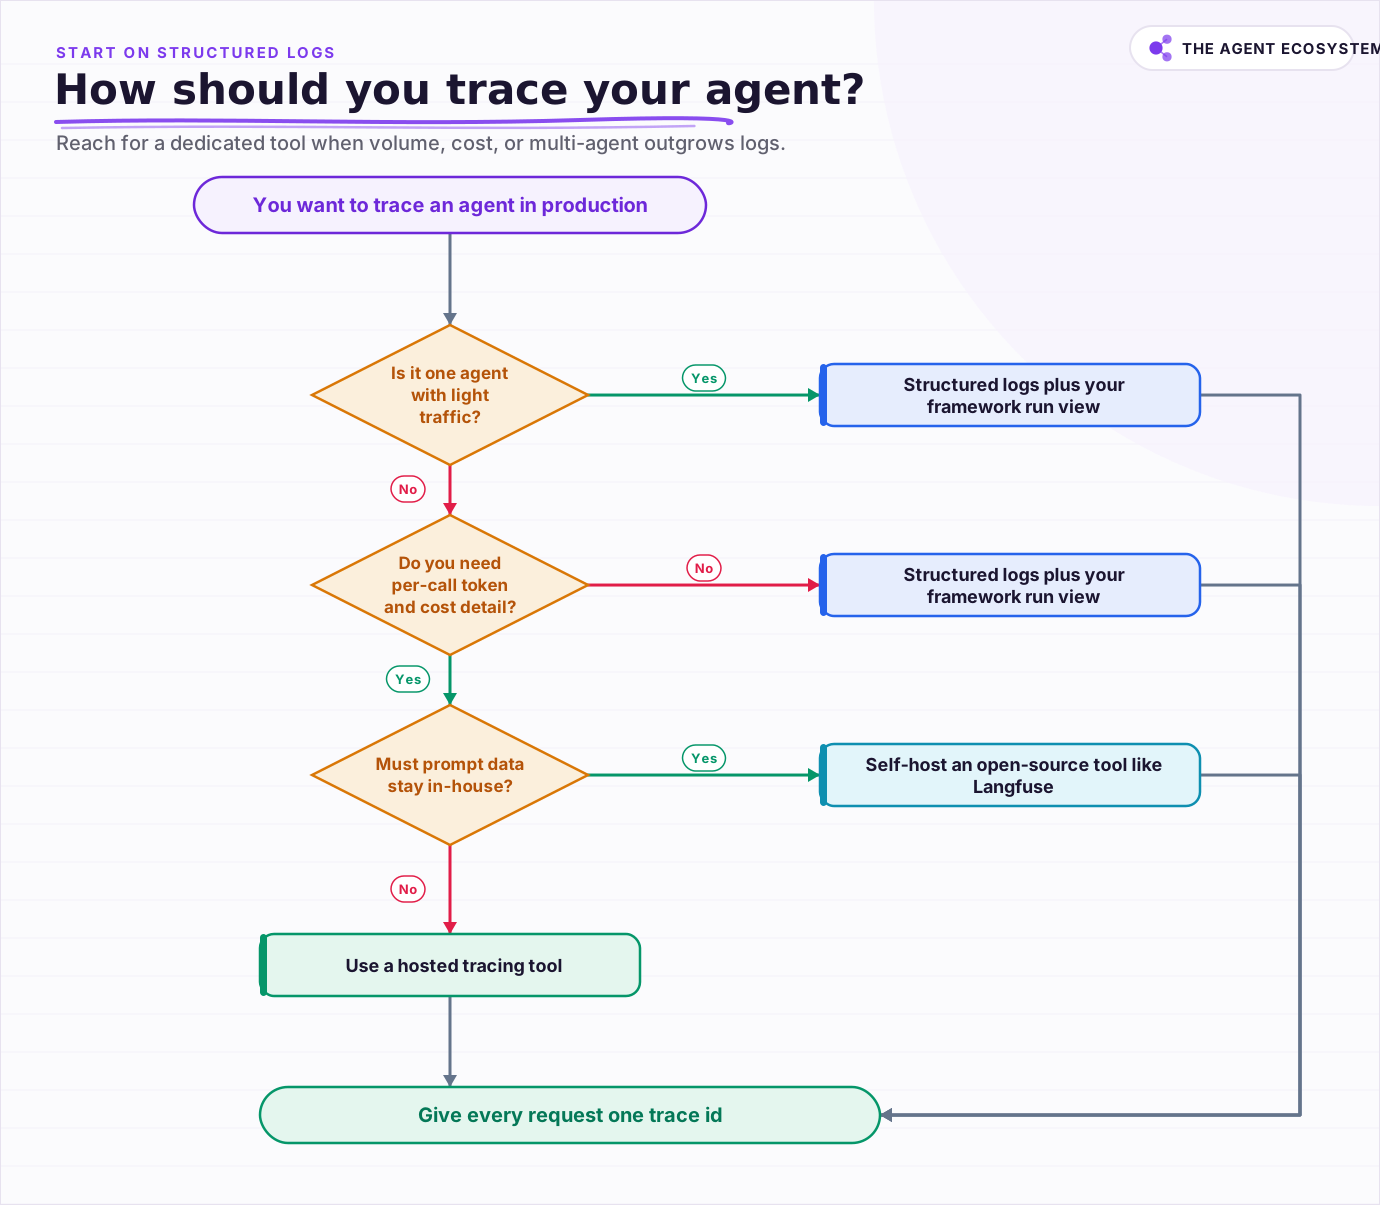 Start on structured logs. Reach for a dedicated tool when volume, cost, or a multi-agent setup outgrows them.
Where observability pays off#
Observability pays off the moment you stop trusting your agent blindly. It turns "it gave a wrong answer" into a specific span you can point at, turns a rising bill into a named loop, and turns a slow response into the one tool call that stalled. You capture the run once and reuse it for debugging, cost control, and evidence.
Start small and honest. Log every step's input, model, tokens, cost, latency, and result to structured logs, and give each request a trace id you can grep. That alone resolves most incidents. Add a dedicated tool when your volume, your bill, or a multi-agent topology outgrows plain logs. The goal never changes: when a run breaks, you should be able to open it and see exactly where.
Frequently asked questions
How is AI agent observability different from testing or evaluation?
What is a trace in the context of an AI agent?
What should I capture for each step of an agent run?
Does n8n give me agent observability out of the box?
Which AI agent observability tool should I use?
Sources
Primary references and vendor documentation used while drafting and reviewing this article.
Written by

Muhammad Qasim Hammad is an AI agent and automation expert and the founder of Cart Gaze LLC (cartgaze.com). He builds product for the love of it: when an idea lands, a working prototype is usually running within hours, built with the same AI agents and automations he sells. He puts his own output at roughly 20× what it was before agents, and the Agentic OS behind this site is the working proof, documented in public with the tools he actually ran and what they really cost.
AI & Automation Services
Want a pipeline like this running in your business?
I'm Qasim — I design and ship AI agents and n8n automations for solo operators and small teams. Tell me what's eating your team's week, and I'll scope a fix.
Related reading
How to Test and Evaluate n8n AI Agents: Accuracy, Mocks and Regression
An AI agent is non-deterministic, so 'it worked when I tried it' is not testing. Use n8n's built-in Evaluation feature, a golden test set, and the right scoring metrics to test n8n AI agents and prove a change made it better, not worse.

What Is an AI Agent? A Plain-English Guide for Builders
An AI agent is a language model running in a loop that decides its own next action, not a chatbot and not a chain. Here is how the perceive-decide-act-observe loop works, how an agent differs from a chatbot, chain, and workflow, and a checklist for when you actually need one.
How to Build an AI Agent: The 80% That Survives Week Two
Most tutorials get you a working agent in ten minutes and skip what breaks it in week two. Sixteen lessons covering the loop, tool descriptions, memory, fallbacks, guardrails, evaluation, and the cost levers that decide your bill.
I Built the Same AI Agent in n8n, Make and LangChain: The Honest Difference
I built the exact same order-status AI agent in n8n, Make.com, and LangChain, then compared setup effort, cost model, portability, and who each platform actually suits.
Give Your n8n AI Agent Tools (Calculator, HTTP, Workflows)
Your n8n AI Agent answers from stale training data until you attach real tools. This guide shows you exactly how to wire HTTP Request, Calculator, and Workflow tools so your agent acts on live data.
Why Your n8n AI Agent Isn't Working: 6 Failure Modes and Fixes
An n8n AI Agent that finishes without an error but ignores its tools, loops until it quits, or returns the wrong shape is almost always a configuration problem. Here are the 6 failure modes that cover most of them, and the specific node setting behind each fix.